Beginning
SysAnalyzer is an application (or rather a set) that allows for quick analysis of malware by observing its activities in different stages of the system.
Before starting the “malicious sample”, the software creates a snapshot of the current state of our environment, which after starting the malware, is the basis for determining changes in the system.
The author of the application is David Zimmer, whom you may know from tools such as PDF Stream Dumper or COMRaider.
In this article, I’ll discuss SysAnalyzer options to make it much easier to use.
Before we start…
Remember that any malware analysis should be carried out in a controlled environment. Running a virtual machine on a private or office computer, which we work on every day is not the best idea. There is always a risk of vulnerability in the software we use for virtualization (there are known cases from the past; e.g., CVE-2014-0983, CVE-2015-3456 and CVE-2008-0923). Try to create a separate environment with dedicated Internet access (and dedicated IP address).
Installation
The installation process is quite simple and you only need to click the “Next” button a few times, apart from defining the place of installation, of course. After installation, the application takes about 8 MB, so it is relatively small.
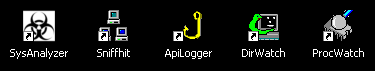
If you have chosen standard options, you should see the five main elements of SysAnalyzer on your desktop (which will be discussed in the next chapter):
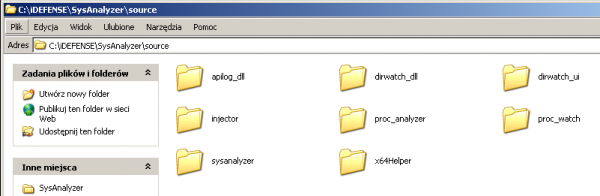
There is also available a source code of this application:
Configuration
In this part we’ll take a closer look at options available in SynAnalyzer tool. After turning on the application, we should see the screen below:
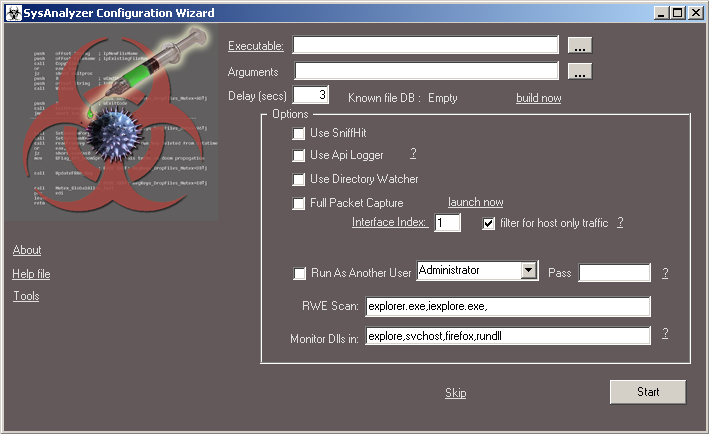
We have given options to choose:
- Executable – location of the malicious application we want to analyze (we can move it using Drag&Drop)
- Arguments – arguments necessary to run a malicious application
Tip: The second option is particularly useful when you want to analyse, for example, the action of potentially malicious documents. Let us take a look at the following simple examples:
Documents *.doc – assuming that to analyse the Microsoft Office software, in the Executable field we specify the location to the main Microsoft Word file; i.e., WINWORD.EXE, and in the Arguments field the location to the *.doc file.
Similarly to the above situation, in the case of e.g. PDF files, we would probably give the location to AcroRd32.exe (Acrobat Reader), depending on the version of the system, etc. The location would be the same as in the case of PDF files.
You should decide which application you want to use based on the file extension and your own experience.
- Delay (secs) – the delay time between the creation of the initial snapshot and the snapshot with which we compare it.
- Known file DB – a database of known and trusted files, invisible in the results.
- Use SniffHit – is responsible for monitoring HTTP, IRC and DNS traffic and creating a list of unique IP addresses.
- Use API Logger – injects the DLL library into the process to show us all called APIs.
- Use Directory Watcher – observes modifications in the file system (created, modified and deleted files and folders).
- Full Packet Capture – full saving of network traffic to *.pcap file.
- Interface Index – number of the network interface.
- Run As Another User – run as another user.
- RWE Scan – scanning of processes for injection in memory (RWE – Read, Write, Execute) and saving the character string drop (from memory).
- Monitor Dlls in – monitoring specific processes for loading new DLL libraries (by introducing *, we include observation of all processes).
There are, of course, additional functions:
- About – information about the application,
- Help file – help.
- Tools – right-click to display options:
- Scan Processes for DLL – searching for character strings in the name of the DLL library or its path.
- Scan Procs for Unknow Dlls – scanning processes for unknown libraries (if we create “Known file DB”).
- RWE Memory Scan All – analogous to “RWE Scan” option with full memory scanning.
- RWE Memory Scan One – analogous to “RWE Scan” option with scanning one process.
- Open Saved Analysis – opening a saved analysis.
- Kill All Like – closing processes whose name contains a specific string.
- External
- SniffHit – launches the Sniffhit application.
- ProcWatch – launches the ProcWatch application.
- Api Logger – launches the ApiLogger application.
- DirWatch – launches the DirWatch application
- Command Prompt – launches the command line in the SysAnalyzer application folder.
- Edit Hosts File – editing the file.
%WINDIR%\system32\drivers\etc\hosts
The “Skip” option (responsible for switching to the manual analysis panel) will be discussed in the Alternative Startup section.
We analyse the file and view the results of the report.
If we have already managed to familiarize ourselves with the basic options of the application, it is time for analysis.
Tip: When using a virtual machine, it is a good idea to do a snapshot before you start so that you can easily return to the initial state afterwards.
An example configuration may look like this:
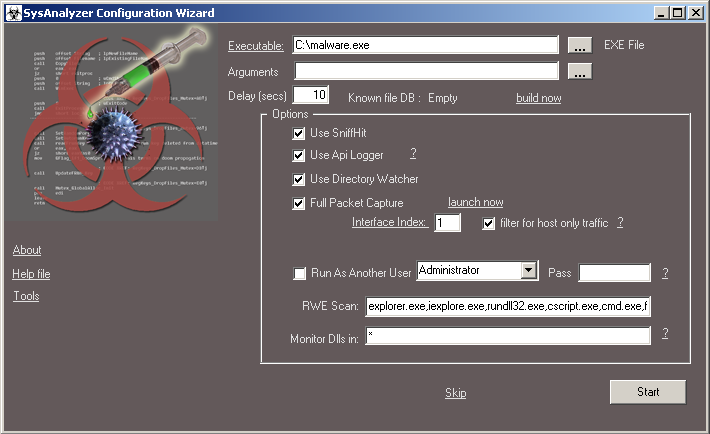
If you have already set all the necessary options, all you have to do is to click the “Start” button.
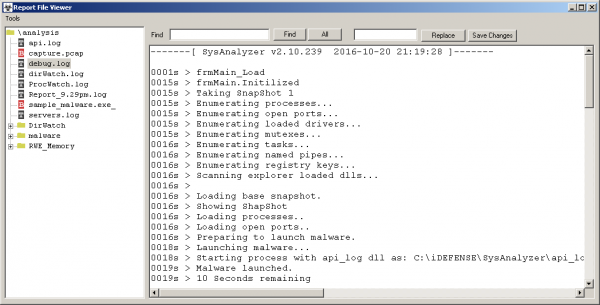
Immediately after starting, we will see successively running tools and information about the launch of our potentially malicious application “malware.exe”, and after a while a report should appear:
As you may have noticed, after starting, a new directory called “analysis” was created on the desktop, in which all the results of the report are saved.
Attention! Please note that some of the information about changes in our environment collected by automatic tools is not always due to malware—sometimes it is just a simple operation of the operating system.
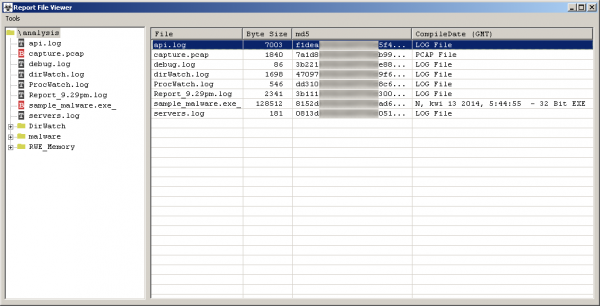
Let’s now look at the information we managed to obtain from the application. We see four main branches:
- \analysis
- DirWatch
- Malware
- RWE_Memory
In “/analysis” section we can find:
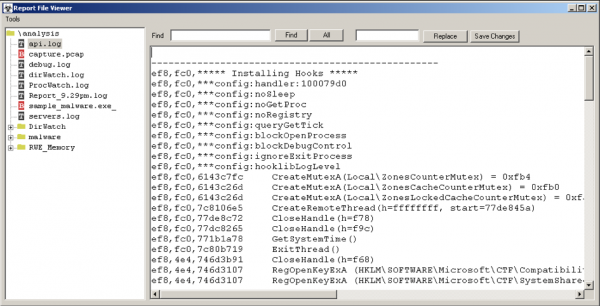
- api.log – list of called out API’s.
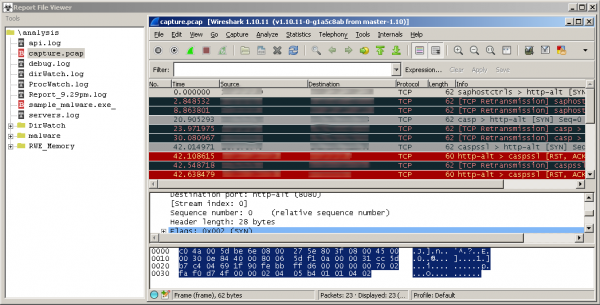
- capture.pcap – recording network traffic (which we can load into Wireshark program).
- debug.log – record of application operation.
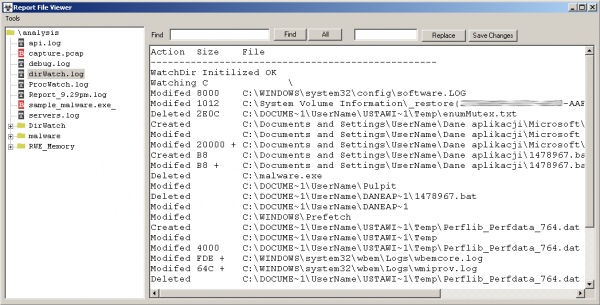
- dirWatch.log – list of created, modified or deleted files and directories.
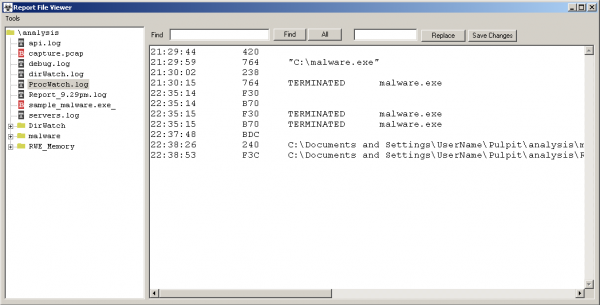
- ProcWatch.log – list of created and closed processes.
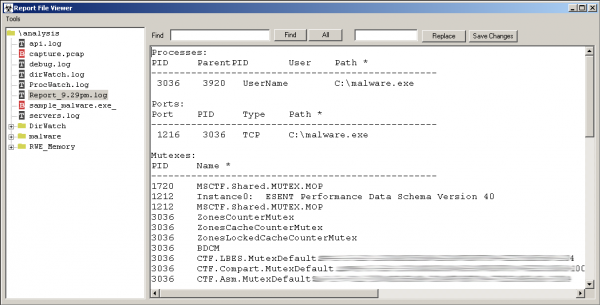
- Report_HOUR-OF-ANALYSE.log – a general set of information about the analysed sample.
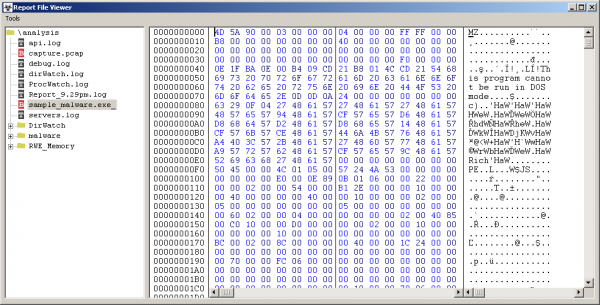
- sample_NAME-OF-ANALYSED-APPLICATION.exe_ – a copy of the analysed application.
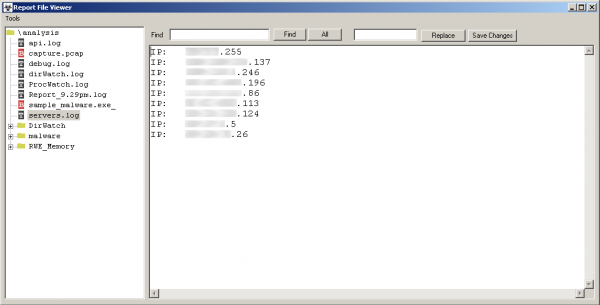
- servers.log – list of IP addresses to which the connection was made.
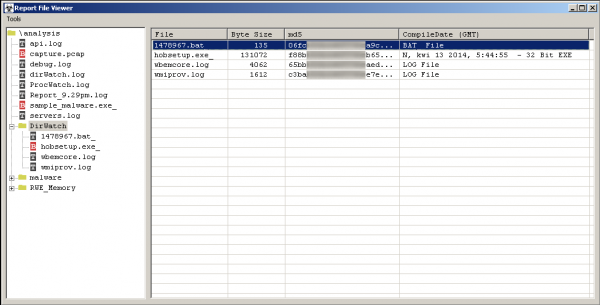
Let’s now look at the “DirWatch” section. We will find here copies of files that were created during the operation of the tested application. As we can see, even the file “1478967. bat_”, which was created and then deleted, was copied so we can view its contents. There are also two files that we are not usually interested in; e.g., wbemcore.log—these are files generated by the WMI service.
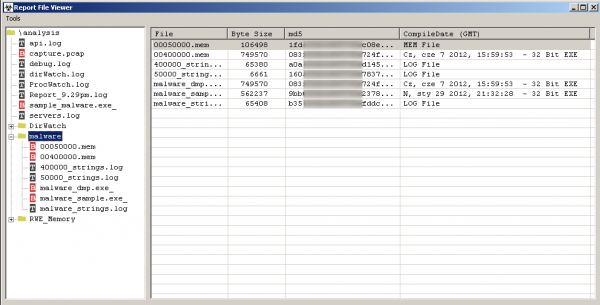
In the “NAME_MALWARE” section (in our example it will be “malware”) we will find, among others, memory snapshots, character strings and a copy of the tested application.
The last section we see is “RWE_Memory”. All names of processes, which we placed in the “RWE Scan” column during configuration, were scanned for injection in memory. So we will see memory shots from the above mentioned processes and their sequences of characters.
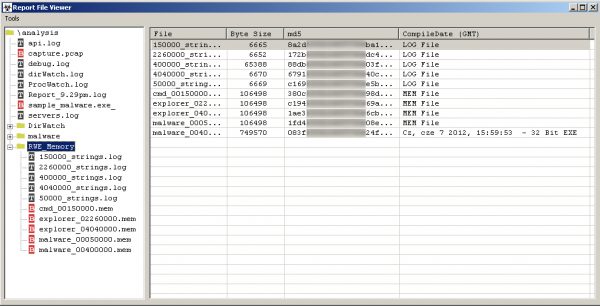
A common example is “loading” a new library for the Explorer. exe process by malware – what will be notified by SysAnalyzer in the report.
Remember: There may be many reasons why our sample did not work. The most common ones are: incorrect launch environment, faulty sample (e.g., lack of code in the sample as a result of antivirus software activity) or the fact that the sample is not malicious.
Alternative commissioning
Go back to the “Skip” option; i.e., to the manual analysis mode.
Let’s first look at the interface:
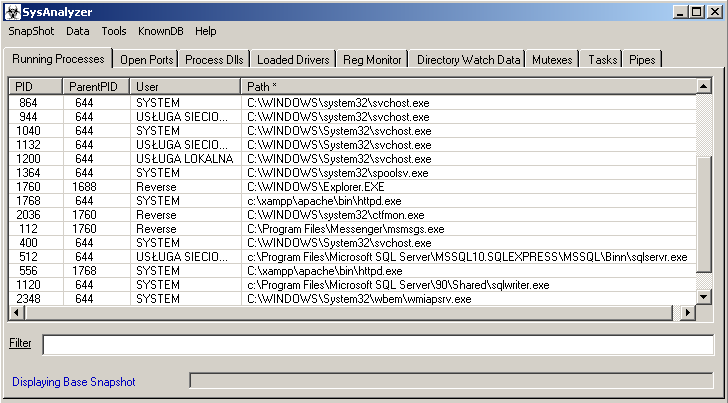
In top menu we have those options to choose from:
- Snapshot
- Show Snapshot 1 – presentation of the initial snapshot.
- Show Snapshot 2 – presentation of the final snapshot (comparison).
- Show Diff report – presentation of differences in snapshots (therefore, after selecting this option, only differences will be visible in the tabs).
- Take Snapshot 1 – create an initial snapshot.
- Take Snapshot 2 – create a final snapshot (comparative).
- Start Over – start a new analysis.
- Data
- Search All Tabs – searching for a given keyword in all collected results.
- Copy All Tabs Data – presentation of all data in a clear form and the possibility of copying or saving them to a file.
- Copy All Selected Entries – presentation of only selected entries in a clear form and the possibility of copying or saving them to a file.
- Basic Text Report – displaying a simple text report (similar / the same as in the “Copy All Tabs Data” option).
- Report Viewer – displaying a standard report presentation window.
- Tools
- Scan Procs for Unknown Dlls – scanning processes for unknown libraries.
- Scan processes For Dll – searching for a given string in the name of the DLL library or its path.
- RWE Memory Scan All – analogous to “RWE Scan” option with full memory scanning.
- String Memory Scan All – scanning the entire memory for the presence of a given keyword.
- Start Directory Watch – start monitoring for created, modified or deleted files and directories.
- Command Prompt – launching the command line in the SysAnalyzer application folder.
- KnownDB
– a very useful option that allows you to create a database of known and
trusted files so that we do not see them in the results.
- Build Known File DB – building a database of known files.
- Hide Known Files – hide known files in the analysis results.
- Update Known Db – updating the database of known files.
- Help – help.
Now let’s go to the tabs. Before we discuss them, it is worth saying that in each of them there is the possibility of filtering the displayed data at different angles (by default, the filter is set to the “Path” column, which is shown * next to the column name. We can change it by typing in the “Filter” field the command “/HERE_NUMBER e.g. /1”, which will set the filtering to the “PID” column).
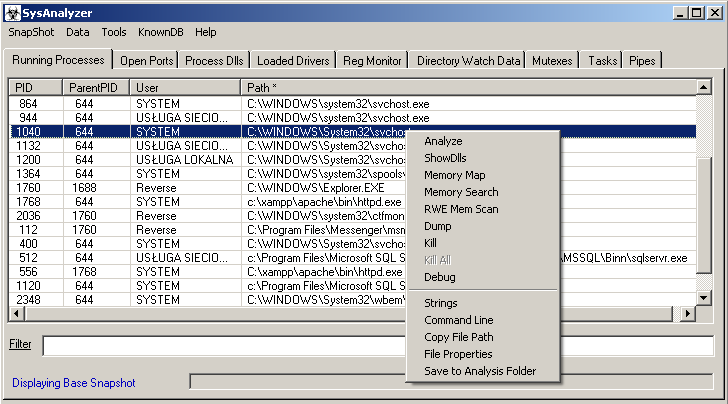
Moreover, in most windows, if you right-click on an entry, you will see an additional menu in which you can analyse a specific process (“Analyze”), display related DLL libraries (“ShowDlls”) and a Memory Map with a list of modules and executable sections (and memory types, etc.), close the process (“Kill”), as well as display the properties of a given file (“File Properties”) or save a process dump to the “analysis” folder.
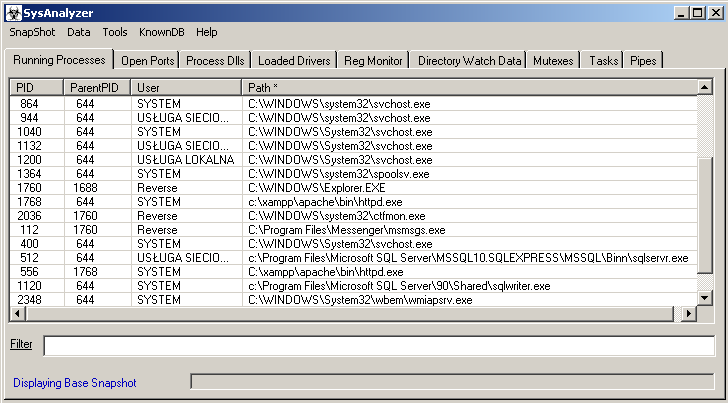
- Running Processes – presenting all running processes
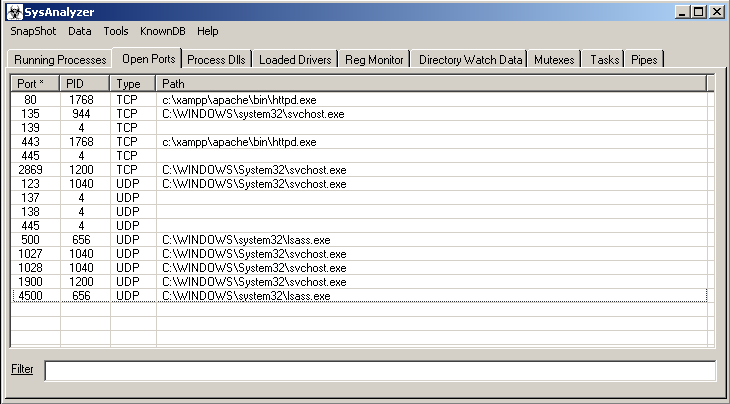
- Open Ports – list of open ports
- Process Dlls – list of DLL libraries connected to this process
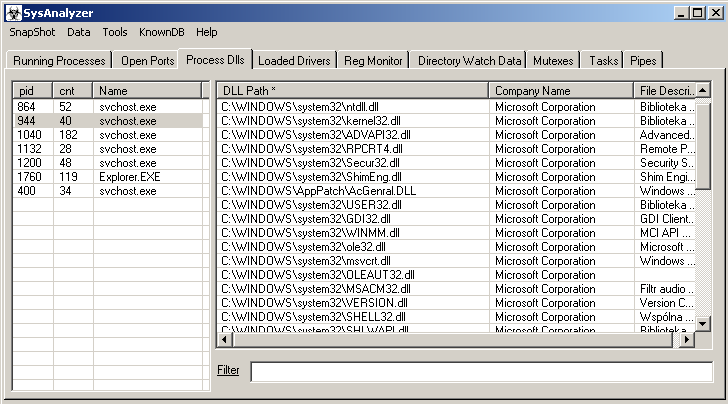
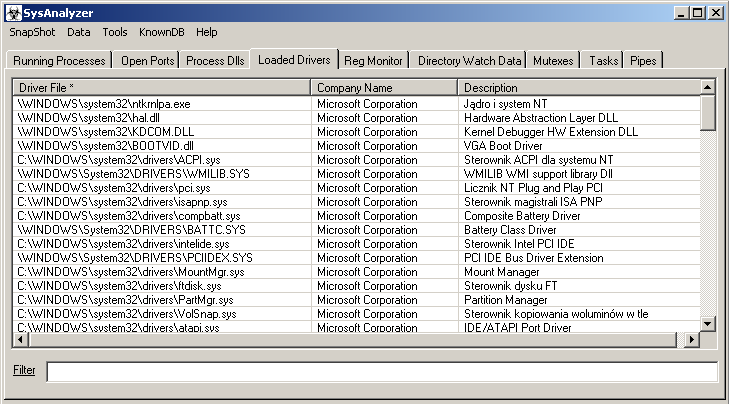
- Loaded Drivers – list of loaded drivers
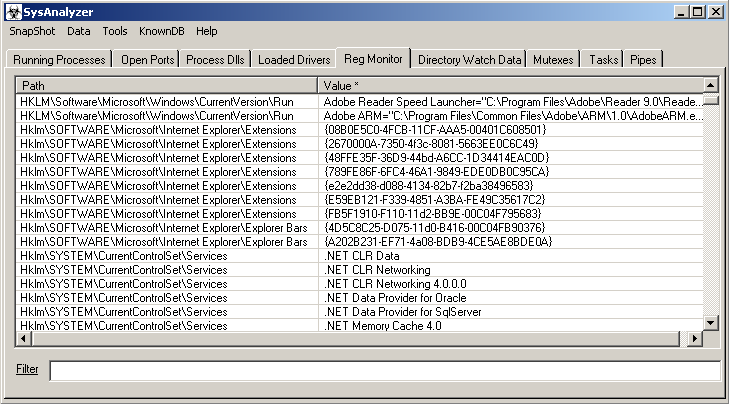
- Reg Monitor – allows to monitor changes occurring in register
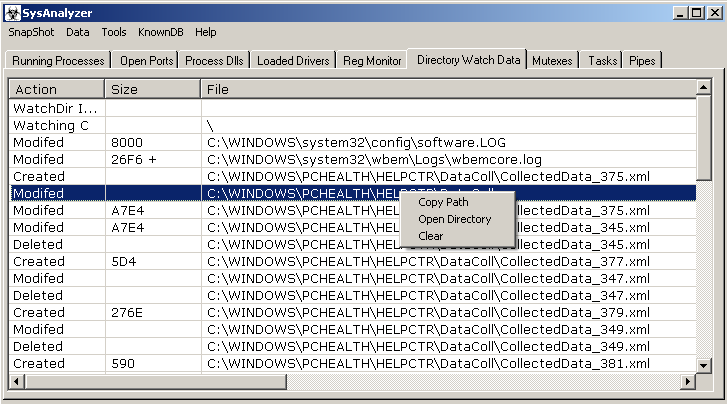
- Directory Watch Data – list of made, modified or deleted files and directories (remember to turn on “Start Directory Watch” option in “Tools” menu)
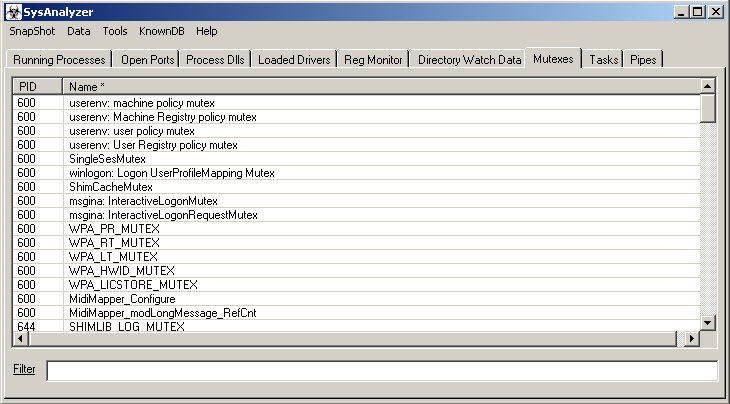
- Mutexes – shows list of mutex’s
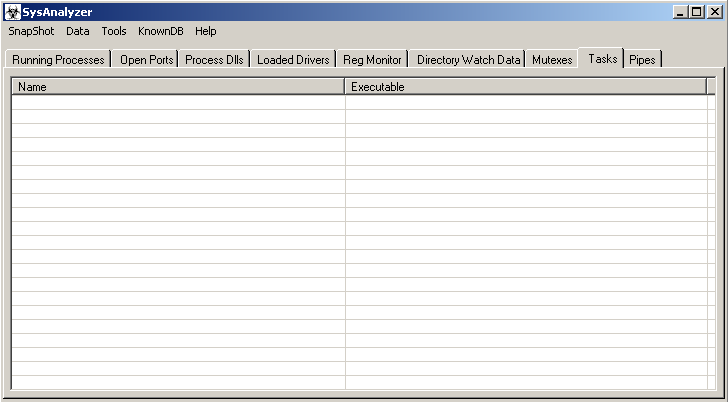
- Tasks – allows to monitor task schedule
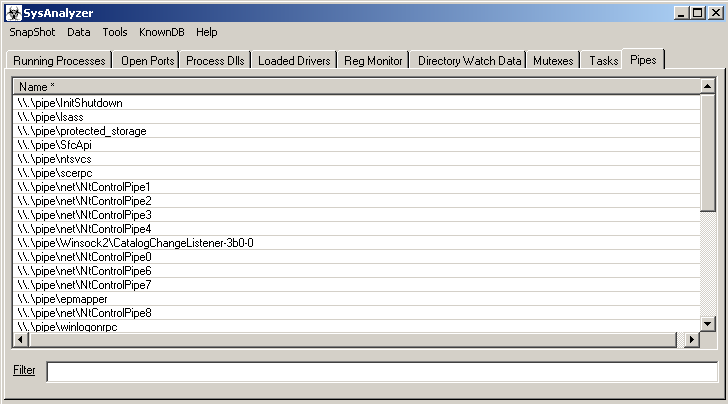
- Pipes – shows list of Pipe’s
How to perform the simplest sample manual analysis
Just create a starter snapshot: “Snapshot” -> “Take Snapshot 1”, and after a while we will launch our malware. After several seconds we should create a final snapshot: “Snapshot” -> “Take Snapshot 2″;. Now we can compare the results of our analysis using the “Snapshot” -> “Show Diff report” option.
Summary
SysAnalyzer is an interesting project that will provide us many useful tools to observe a potentially malicious application from different angles. During the analysis of several dozen samples in the tests, several of them did not start up for an unspecified reason in automatic mode. However, the manual mode already gave positive results. If you don’t have time for analysis, and you would like to analyse a given application (not only a malicious one), it’s worth choosing SysAnalyzer.
Download:
Sources of samples for analysis (selected):
- http://contagiodump.blogspot.com/
- http://www.kernelmode.info/forum/viewforum.php?f=16
- https://malwr.com/
- https://virusshare.com/
- http://thezoo.morirt.com/
- https://zeustracker.abuse.ch/monitor.php
- https://ransomwaretracker.abuse.ch/tracker/online/
- http://malc0de.com/database/
- http://www.malwareblacklist.com/showMDL.php